-
Code
-
Code
-
Code
This page is intented as a 2-3 hours workshop where you'll learn how to make generative visuals using javascript canvas.
To get a good grasp on the inner working of the code I recommend following the steps, but if you're lost, feel free to refer to the code of those working examples
| Nested Ellipses
- Code |
|
|---|---|
| Lines - Code |
|
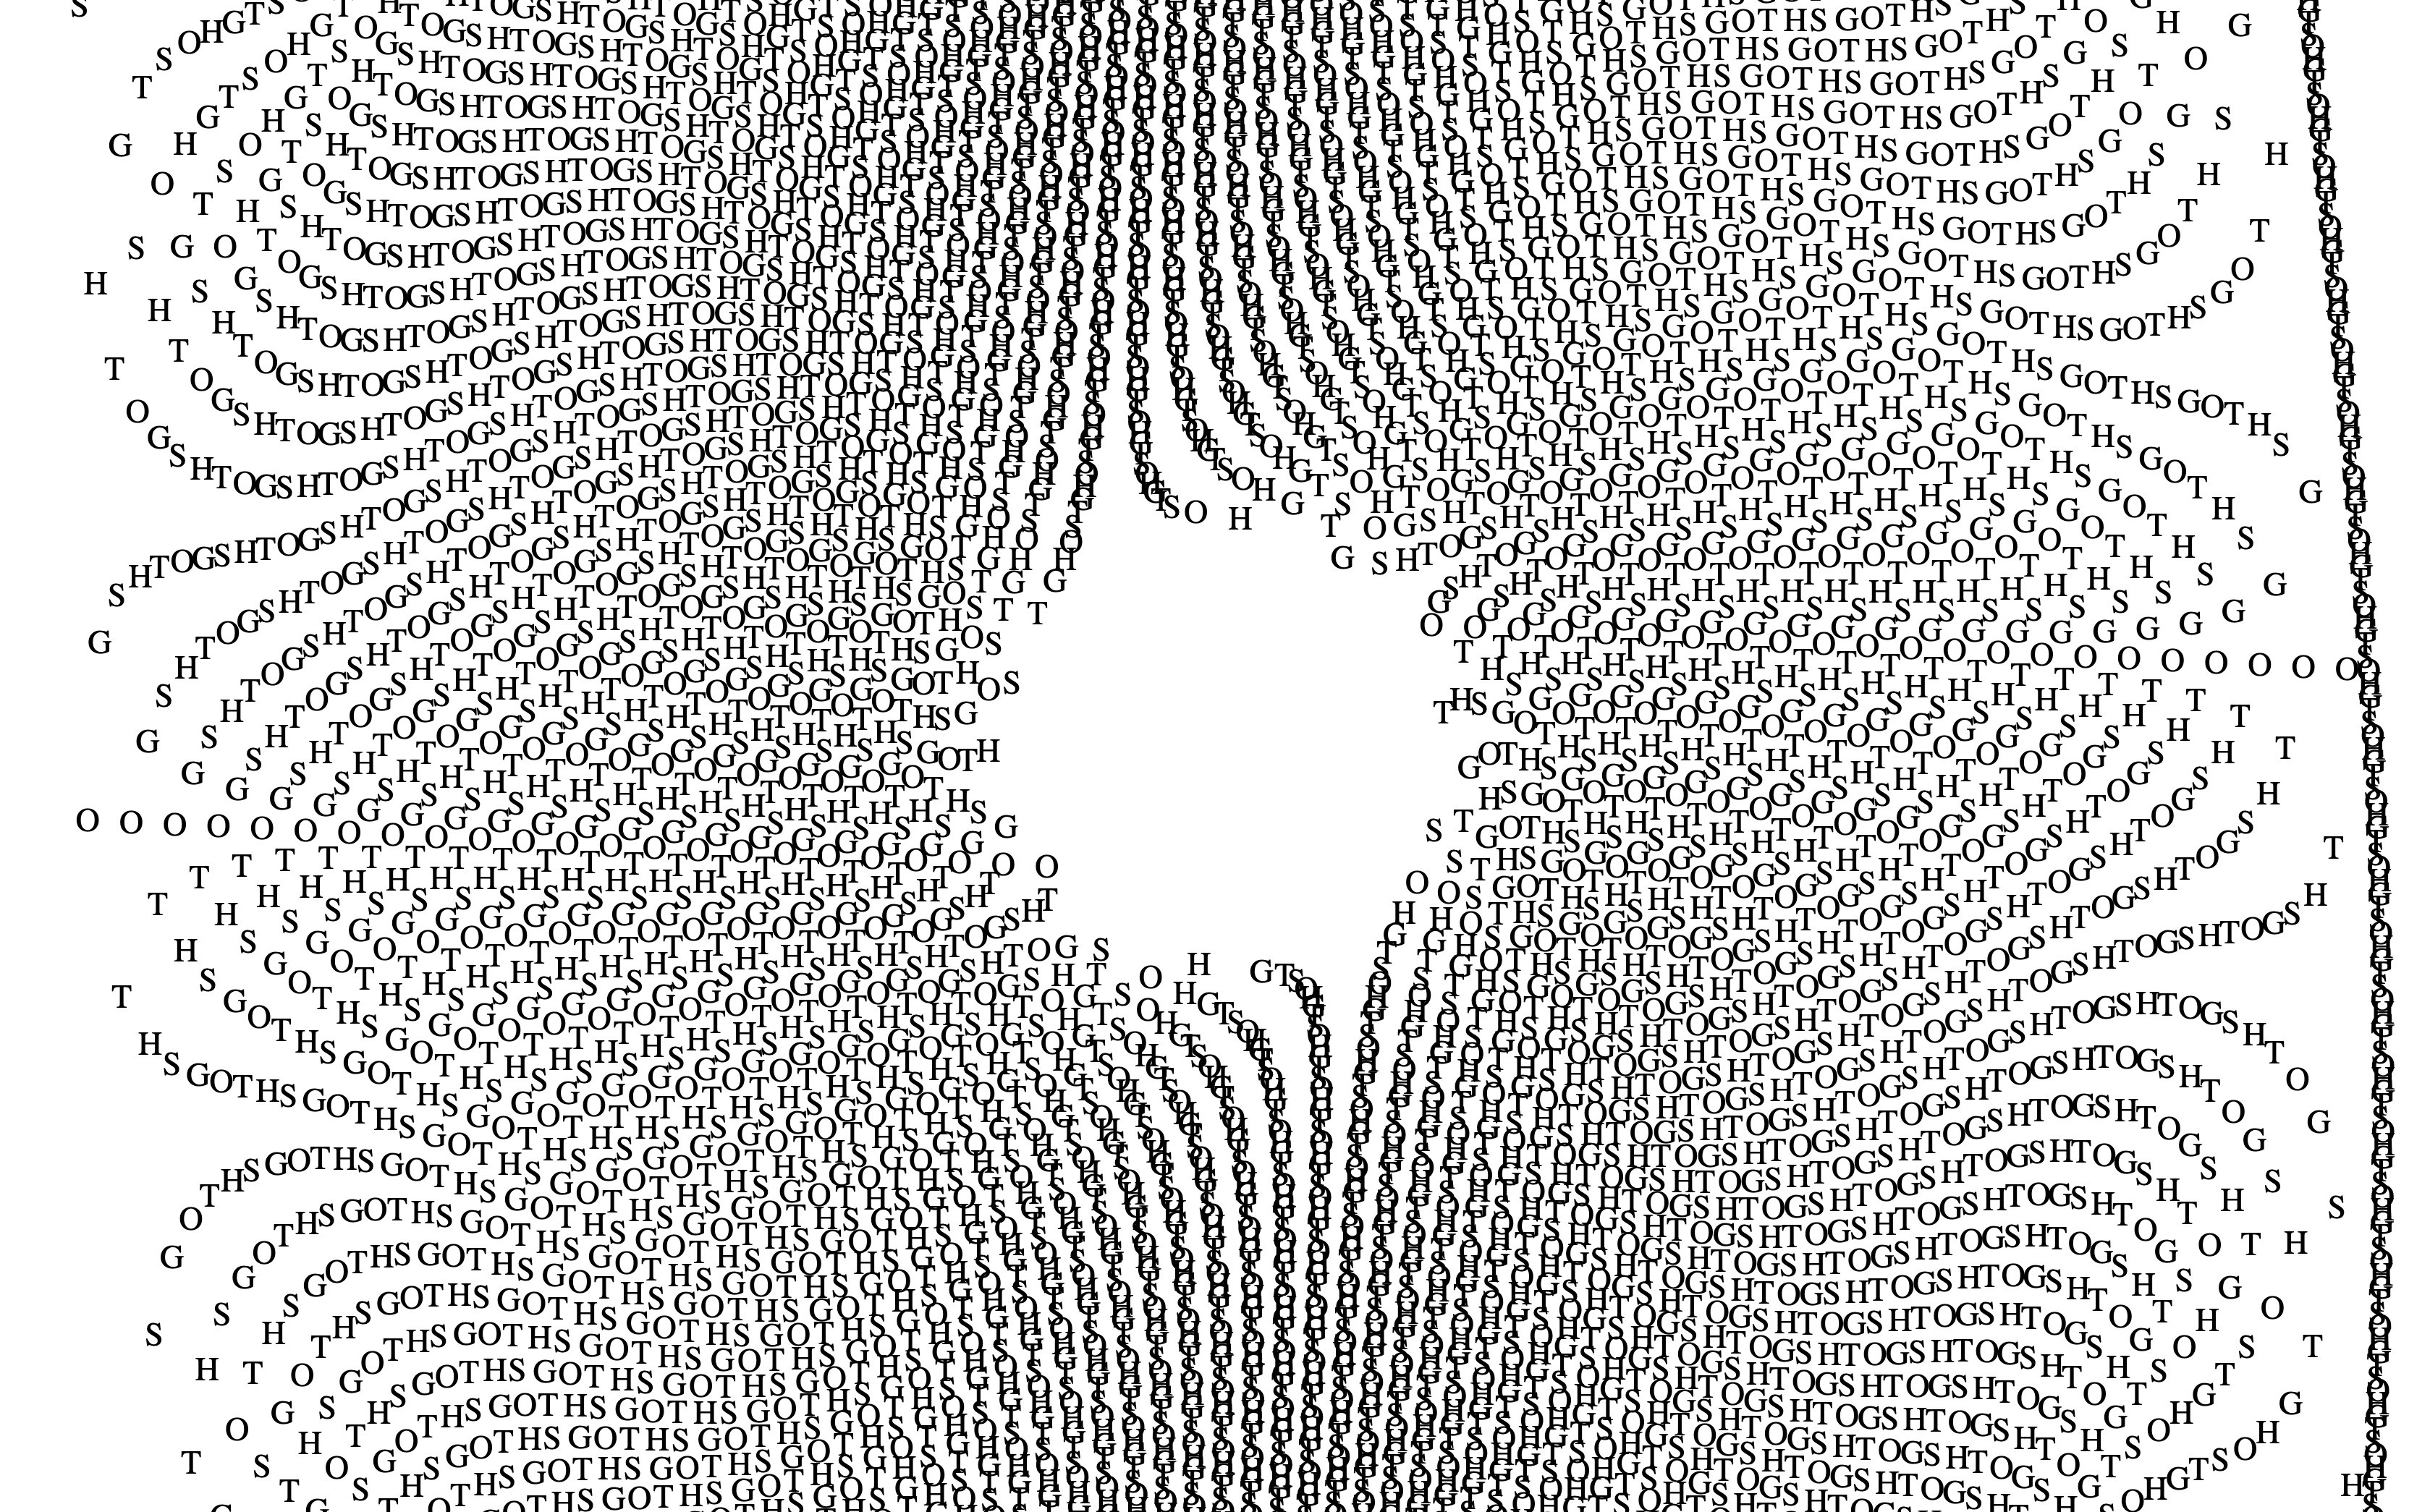
| Font - Code |
|
All the code below doesn't reflect good coding practices, all of this works, enough to get a image file at the output. I wouldn't recommend any of this for a serious project, as the optimisation is subpar.
Don't hesitate to reach out to me if you have any question !
A website revolves around three languages
HTML - Content of the pageCSS - Style of the pageJavascript - Dynamic hand modifying the data in the HTML and CSS
In big websites you'll have three files, one .html, one .css and one .js but in fact you can have everything in the same file using <style> for the CSS and <script> for the JS which is much more convenient for this kind of little project.
We will not be using the internet per se, but we will be using the same languages and tools that you would use to create a website.
Those languages are made to be easily interpreted by the browser that does the heavy lifting of discussing with your operating system
(that way you don't have to manage the memory, or address the pixel one by one) but everything will be done offline.
Instead of having a distant server that answer your query and return instructions, your computer will act as both (the client and the server, technically).
You can notice that when you enable the preview later on, the browser actually connects to http://127.0.0.1:3000/index.html, 127.0.0.1 actually being the ip adress of yourself !
cmd+O, ctrl+O)cmd+n, ctrl+n)cmd+s, ctrl+s) as index.htmlWe can now add a bunch of things to the file
<html>
<body>
Hello World !
</body>
</html>
Click on the little icon with a magnifier glass in the top right to open the preview, you should see a page with Hello World ! written.
Let's add styles to showcase what the CSS is about
<html>
<head>
        <style>
            html{
                color: red;
            }
        </style>
</head>
<body>
Hello World !
</body>
</html>
Your text should now be red. Now let's use javascript !
In the body part of the html, let's create a canvas with id="canvas" (which will let us refer to it later), and a width and height of 400 pixels.
Then, let's add a <script> after the body. This is where the javascript will live. We can retrieve the <canvas> item by refering to its name, and get its graphical context (it's where all the graphical data about the canvas are).
Once we have this, we can already draw on the canvas ! Let's use the function ellipse() to draw a circle.
<html>
    <head>
        <style>
        </style>
    </head>
    <body>
        <canvas id="canvas" width="400" height="400"></canvas>
    </body>
    <script>
        canvas = document.getElementById("canvas");
        context = canvas.getContext("2d");
        context.beginPath();
        context.ellipse(100, 100, 100, 100, 0, 0, 2 * Math.PI);
        context.stroke();
    </script>
</html>
If you have a high resolution screen, the cricle might appear blurry, we'll learn how to fix this later, see Dynamically resizing window.
If you want to check the value of a variable, you'll need the console.
Head over to the devtool pane (hidden in the burger menu in the top right of the preview window).
Once you focus the console, you can add console.log(1+1) somewhere in the javascript, you should see 2 appear in the console !
The console of visual studio code contains a lot of other informations, if you want something cleaner, you can open the preview in a dedicated browser (either by copy pasting the url, or by clicking "Open in Browser" in the burger menu), and open the inspector (cmd+alt+i on Firefox and Chrome).
By wrapping the ellipse in a function, we can make its use easier.
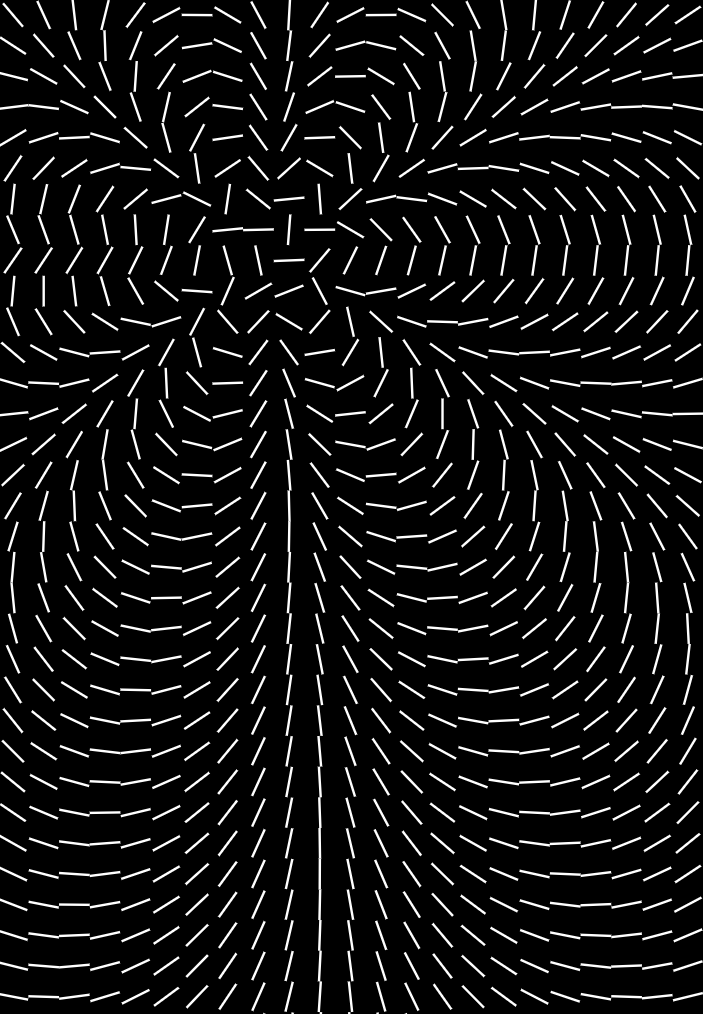
Also, writing this kind of wrapper is a great way to approach a function differently, leading to different result, see the Lines example - (Code) where I draw lines from the center instead of the default pointA->pointB approach.
<script>
        function drawEllipse(context, centerx, centery, width, height){
            context.beginPath();
            context.ellipse(centerx, centery, width, height, 0, 0, 2 * Math.PI);
            context.stroke();
        }

        canvas = document.getElementById("canvas");
        context = canvas.getContext("2d");
        drawEllipse(context, 100, 100, 100, 100);
</script>
save as....
As simple as that !
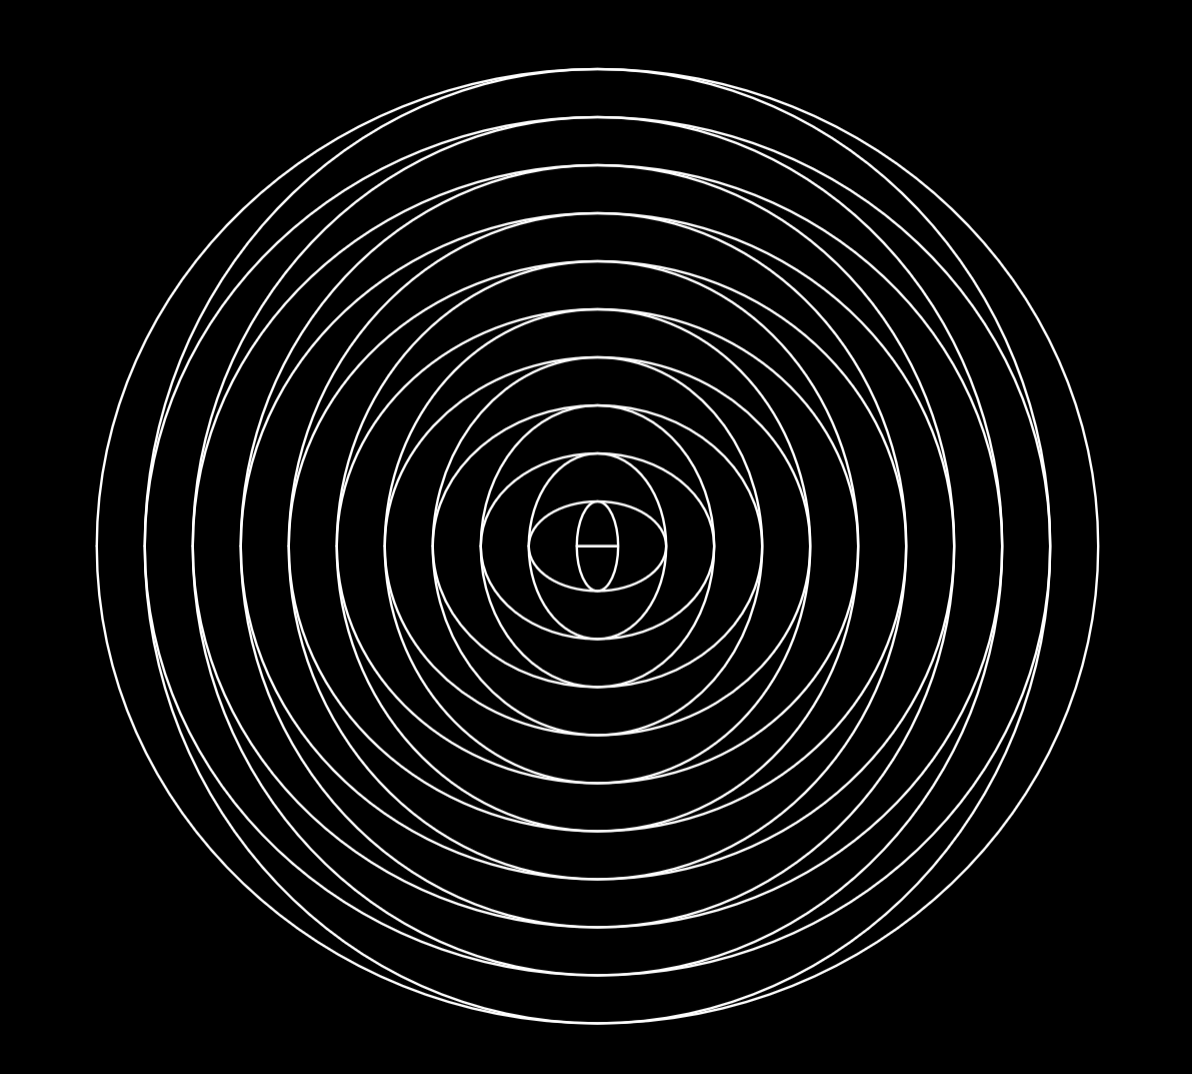
A for loop is a simple way to make complex geometrical pattern emerge.
It allows you to repeat a part of the code while making the parameter evolve.
For example to make, 5 concentric circles with 10 pixels between each one of them, you can either write
drawEllipse(context, 100, 100, 100, 100);
drawEllipse(context, 100, 100, 110, 110);
drawEllipse(context, 100, 100, 120, 120);
drawEllipse(context, 100, 100, 130, 130);
drawEllipse(context, 100, 100, 140, 140);
or, by using a for loop
for (i = 0; i!=5; i = i+1){
	drawEllipse(context, 100, 100, 100+i*10, 100+i*10);
}
Which is more malleable. If you want to make a change, you don't have to edit each line separately, and you can easily make hundreds of iterations !
The preview extension reload the page for every character you type.
While writing the for loop, the page might load in a configuration that create an infinite loop, this will break the preview server.
You'll probably have to quit and reopen vscode.
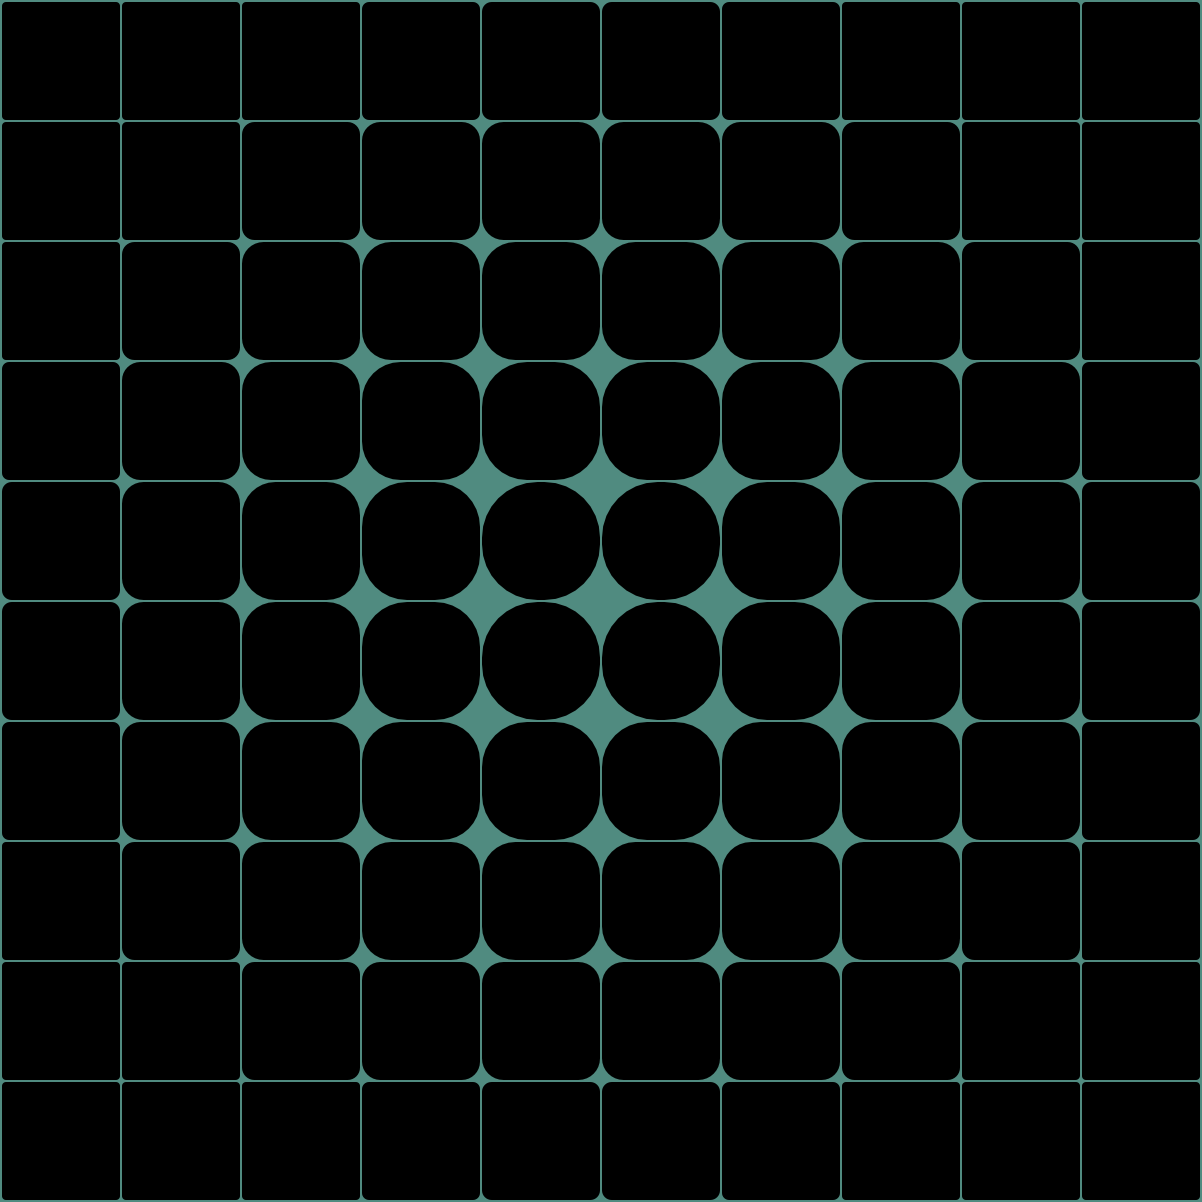
One interesting path to explore with generative drawing is the grid. Once you've divided your canvas into divisions, it's easy to map some variable on the properties of each form. For example, fill every division with an ellipse, then increase the width of the ellipse depending on its posisition on the x axis.
Here is a very cool article about grid art.Some source of data to make the pattern evolve in space
Math.sin/Math.cos/etc...Math.random())
The Lines example - (Code) is good strating point to experiment with grids, I use angle to some point + sin() modifier for this one.
As a little example, here is a grid of circles where the x axis defines the width of cricles + offset their positions, modified by a sin() function
A generative script is always evolving, remember to take screenshots or make git commits when you find something interesting. Take notes ! Think about what is working well in what your doing, see the potential openings, plan your next step.
Clean your code from time to time. It's not necessarily the most interesting part, but it's a good way to learn new stuff and to spark inspiration by spotting new occasions. It also makes it easier to get back in the code after a few days.
<html>
	<head>
		<style>
			/* CSS */
		</style>
	</head>
	<body>
		<div class="params">
		<!-- list of parameter-->
		</div>
                <canvas id="canvas">
	<body>
	<script>
	// init stuff
	canvas = document.getElementById("canvas");

	// geometrical functions
	function drawEllipse(...){...}

	// drawing
	function generate(){
	context = canvas.getContext("2d");
        ...
	}

	generate() // you need to call the function at least once
	</script>
</html>
Now that we have separated the visual generation function from the technical context, we can work on some improvements, for example, resizing the visual when we resize the browser window. This will also allow us to fix the blur problem that can arise on high resolution screens.
To do this we'll remove the canvas we have in the <body>, we'll create it in the javascript to have more freedom. Replace the init stuff by those lines
function makeHiPPI(canvas, width, height) {
    // get the info from the screen to correct the ratio
    const ratio = window.devicePixelRatio;

    canvas.width = width * ratio;
    canvas.height = height * ratio;
    canvas.style.width = width + "px";
    canvas.style.height = height + "px";
    canvas.getContext("2d").scale(ratio, ratio);

    return canvas;
}

function updatesize() {
    canvas = makeHiPPI(canvas, window.innerWidth, window.innerHeight);
    generate(); // update the visual once the canva is resized
}

// init
var canvas = document.createElement("canvas"); // create a canvas
updatesize(window.innerWidth, window.innerHeight); // sets its size
document.body.appendChild(canvas); // add the canvas to the webpage

window.addEventListener("resize", updatesize); // update the size on each window resize
Changing value by hand in the code is a good way to prototype ideas, but adding parameters will let you iterate quicker, and find more sweet spots in the interactions of multiple parameters.
To call our generate() function each time a parameter is modified, we'll use oninput="generate()" in the parameter description.
We'll put all the parameters in a dedicated division in the <body>, this will let us link a style to the group.
<div class="params">
<!-- The class is an id to change the style of the element -->
<label for="param">param</label>
<input type="range" id="param" min="0" max="1" step="0.01" value="0.5" oninput="generate()">
</div>
Now, you should have a slider at the top of the window, which is not super convenient nor pretty. You can make a little menu that hover over the visual with css. If you need them to disappear, you can add a line opacity:0; to the code below.
<head>
    <style>
       .params {
            position: absolute;
            background: #11111122;
            /* top: 2rem; */
            right: 0.0rem;
            /* left: 0.1rem; */
            display: flex;
            flex-direction: column;
            padding: 1rem;
            border-radius: 1em;
        }
    </style>
</head>
Once the parameter exists in the HTML, you can retrieve its value in the script. I recommend doing all the parameter retrieval at the same place, in the beggining of the generate funtion
function generate() {
            //INIT
            var width = window.innerWidth;
            var height = window.innerHeight;
            ctx = canvas.getContext("2d");
            ctx.clearRect(0, 0, width, height);
            //PARAMS
            var rotation = Number(document.getElementById("rotation").value);
            var div = Number(document.getElementById("division").value);
            //VISUAL
            ...
Some important detail in this code :
clearRect() function lets us clean the slate before drawing again with new parameters (remove it and see what happens !)Number() function convert the parameter value to a number. The value is stored as a string of text by default, which can create insidious bugs when making mathematical operations (e.g. if param = "0.10" and variable = 0.10, then param+variable=0.100.10)
To add movement, we'll need a way to count time.
The requestAnimationFrame() function is a good candidate as it call a function at the framerate of the computer.
You can also use setInterval() that calls a function every X milliseconds, which will allow you to have more control on the refresh rate.
The upside of having a separate function for time accounting is that resizing the window or other interaction doesn't impact the time keeping when calling the generate() for redrawing.
After the canvas generation, outside the generate() function, add this code
//animation
function update() {
    rate = Number(document.getElementById("rate").value);
    counter = counter + rate;
    lfo1 = Math.sin(counter);
    generate();
}

// call update every 16ms
setInterval(update, 16);

var lfo1 = 0;
var counter = 0;
Then in the parameter retrieval part of the generate(), you can add lfo1 to whatever parameter values !
Clipping values with Math.min() & Math.max() can help keep control and avoid some bugs when value goes below 0 for example.
Creating interesting modulation signal is then a world on its own, create multiple lfos, with different forms, do squares with comparison, use shaping function such as Math.floor() to create edges, add, substract, mess around !
a) Modify the drawEllipse function to use the angle radius of the ellipse
b) Write a function to draw a line with in input (centerx, centery, angle, lenght)
c) Reproduce the following picture (Hint : it's a combination of grid, distance computing, and roundRect() function)